China made 773,074 industrial robots in 2025, up 28%, while service robot growth faded into 2026
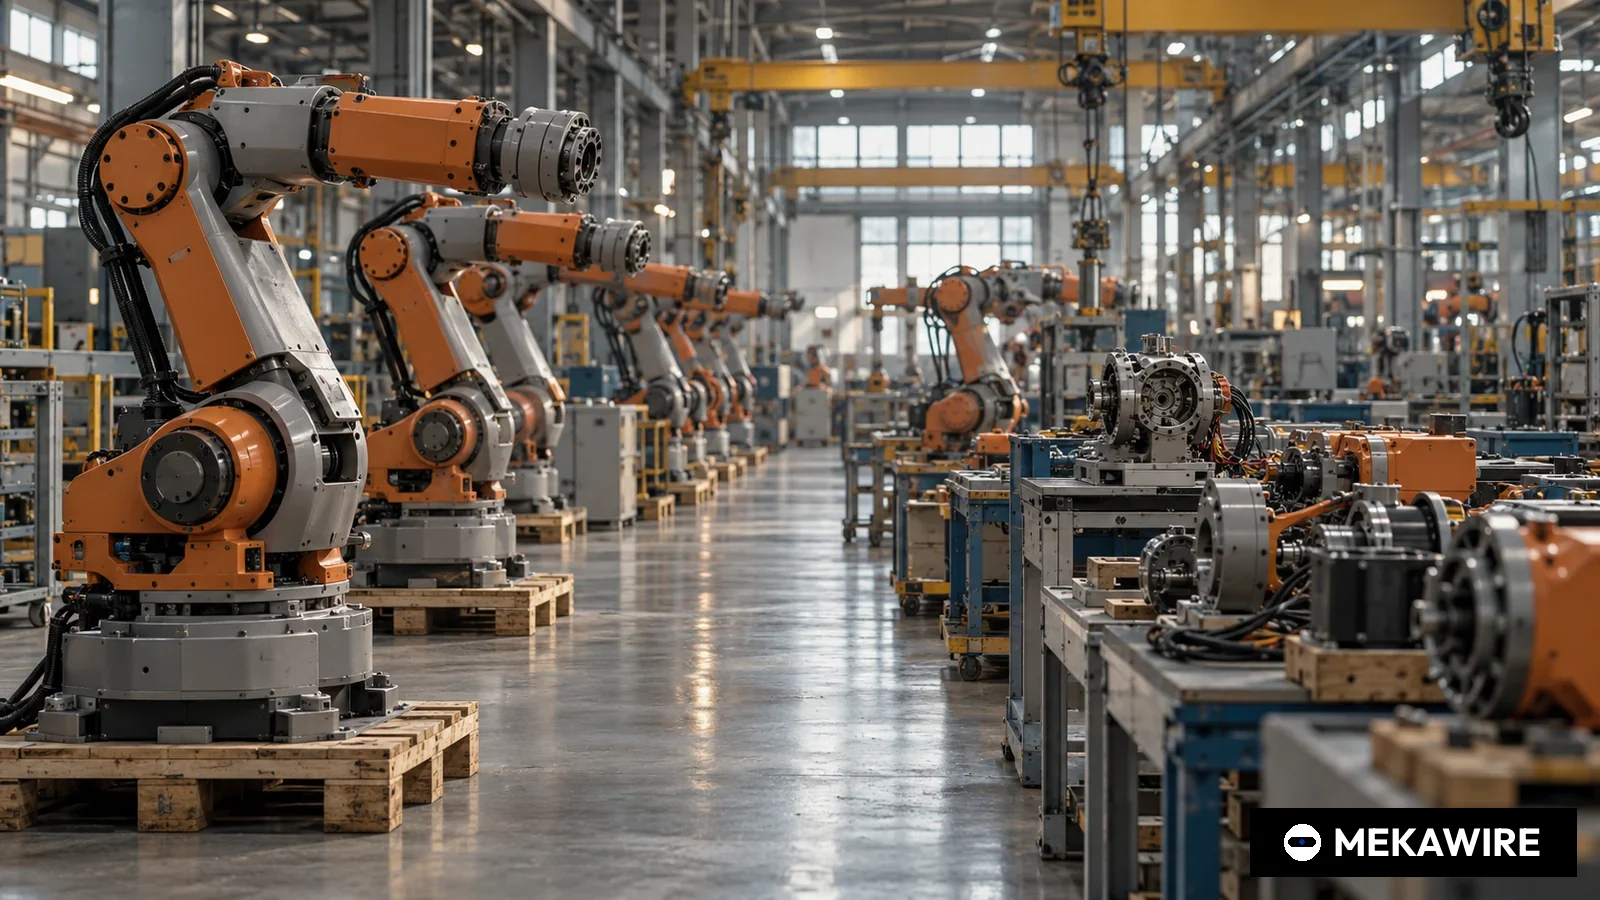
China's National Bureau of Statistics confirmed on 28 February 2026 that industrial robot output rose 28.0% on a comparable basis to 773,074 sets in 2025, and service robot output climbed 16.1% to 18,581,081 sets.
Data for January and February 2026 showed industrial robots accelerating to 31.1% growth while service robots grew only 1.0%.
China's factories turned out 773,074 industrial robots in 2025, 28.0% more than a year earlier on a comparable basis, according to the National Bureau of Statistics (NBS), which confirmed the figure in its annual statistical communique published on 28 February 2026. Output of service robots reached 18,581,081 sets, an increase of 16.1%, the bureau said.
The robot numbers stood out against the wider economy. The NBS put 2025 gross domestic product at 140,187.9 billion yuan, up 5.0%, with value added at industrial enterprises above designated size up 5.9%, high technology manufacturing up 9.4% and equipment manufacturing up 9.2%. Among the new industrial products the bureau tracks, industrial robots grew faster than new energy vehicles, whose output rose 25.1% to 16.524 million units, and integrated circuits, which rose 10.9% to 484.28 billion pieces. Only 3D printing equipment, up 52.5% to 5.211 million units, grew faster in the communique's list.
Momentum held into the end of the year. In its December release on 19 January 2026, the NBS reported December industrial robot output of 90,116 sets, up 14.7% from a year earlier, and December service robot output of 1,564,018 sets, up 4.6%. At a press conference the same day, NBS commissioner Kang Yi cited 28% growth in industrial robots and 37.3% growth in civilian drones as evidence of what Beijing calls new quality productive forces. He said humanoid robots had moved from the Spring Festival Gala stage to robot sports events and were now entering factories in organised units.
The first official reading for 2026 pointed in two directions. The NBS said on 16 March that industrial robot output in January and February combined reached 143,608 sets, up 31.1%, while service robot output was 2,547,480 sets, up just 1.0%. Industrial value added grew 6.3% in the period and high technology manufacturing 13.1%. Sun Xiao, chief statistician of the bureau's industry department, said output of industrial control computers, 3D printing equipment and industrial robots rose 90.0%, 54.1% and 31.1% respectively, and credited equipment upgrades and faster robot production for 8.9% growth in general equipment manufacturing.
The headline totals need careful handling. The 2024 communique reported industrial robot output of 556,000 sets, up 14.2%, and service robot output of 10.519 million sets, up 15.6%. Dividing the 2025 totals by those 2024 totals would suggest growth of about 39% for industrial robots and about 77% for service robots, far above the official rates. The NBS explains in its release notes that the population of enterprises above designated size changes every year, so it calculates year on year growth against prior year data for a set of companies kept as close as possible to the current one. The published growth rates, not the ratio of the two totals, are the like for like measure.
The International Federation of Robotics (IFR) offers the closest international yardstick, although it counts installations rather than production. Its World Robotics 2025 report, released on 25 September 2025, said 542,000 industrial robots were installed worldwide in 2024, of which 295,000, or 54%, went into China, the highest annual total on record. Chinese suppliers held 57% of their home market in 2024, up from about 28% a decade earlier, the IFR said. Installations fell in every other large market, by 4% to 44,500 units in Japan, by 9% to 34,200 in the United States, by 3% to 30,600 in South Korea and by 5% to 26,982 in Germany.
- China, industrial robot output (NBS)
- 2025
- 773,074
- 28
- China, industrial robot output (NBS)
- 2024
- 556,000
- 14.2
- China, service robot output (NBS)
- 2025
- 18,581,081
- 16.1
- China, industrial robot installations (IFR)
- 2024
- 295,000
- No data
- Japan, installations (IFR)
- 2024
- 44,500
- -4
- United States, installations (IFR)
- 2024
- 34,200
- -9
- South Korea, installations (IFR)
- 2024
- 30,600
- -3
- Germany, installations (IFR)
- 2024
- 26,982
- -5
NBS figures are production by enterprises above designated size; growth rates are as published by the NBS on a comparable enterprise basis and are not the ratio of the two annual totals. IFR figures are installations of industrial robots, a different measure. All figures disclosed, none estimated.
As of Oct 1, 2026
The NBS series does not break output down by robot type, payload, price or destination, and the bureau does not publish a separate line for humanoid robots. That leaves open how much of the 2025 increase came from conventional articulated arms for automotive and electronics lines, how much from lighter collaborative arms, and how much from units shipped abroad. The IFR count of 295,000 installations in China in 2024 is well below the NBS output figure for the same year, a gap the two bodies' different definitions and coverage do not allow outsiders to reconcile line by line.
The divergence inside the 2026 data is the more immediate question. Service robots, a category that spans cleaning machines, delivery and reception robots and consumer devices, grew 23.3% in 2023, 15.6% in 2024 and 16.1% in 2025 according to successive communiques, before slowing to 1.0% in the first two months of 2026 and 4.6% in December 2025. The NBS combines January and February to smooth the Spring Festival holiday, which fell on 17 February in 2026, so a single two month reading may still be distorted.
The next checkpoints are the NBS release for March and the first quarter, scheduled for mid April, and monthly releases thereafter, followed by the IFR's World Robotics 2026 report, which the federation normally publishes in September.
MEKAWIRE analysis
China's 2025 robot boom was an industrial robot story, and the near flat service robot reading for early 2026 is the first official number that argues against extrapolating it to consumer and humanoid machines.
The evidence is in the official series. Industrial robot growth accelerated from 14.2% in 2024 to 28.0% in 2025 and 31.1% in January and February 2026, while service robots decelerated from 16.1% for 2025 to 4.6% in December and 1.0% in the first two months of 2026. The IFR data show that China absorbed 54% of global installations in 2024 while Japan, the United States, South Korea and Germany all shrank, and that domestic brands already supply 57% of the Chinese market. Demand for factory automation, increasingly met by Chinese vendors, is what the numbers measure most clearly.
The strongest counter-argument is that the service robot slowdown is a statistical artefact. Two months of data that straddle the Spring Festival, a category definition that lumps vacuum cleaners with reception robots, and an enterprise universe that shifts every year could all depress the comparable growth rate without any change in underlying demand. Humanoid production is still too small to move an 18.6 million unit category in either direction.
Bull case. If industrial robot output keeps growing near 30% through 2026, China would extend its lead as the world's largest market and, with domestic brands above half of local demand, would supply a growing share of the components and software that humanoid makers draw on. Policy statements such as Kang Yi's would then be backed by volume, not showcases.
Bear case. Rapid output growth with no published price or margin data could mask falling unit values and overcapacity among Chinese arm makers, a pattern already visible in other strategic industries. A sustained stall in service robots would undercut the consumer narrative that much of the 2026 embodied AI financing assumes.
Signals to watch:
- Mid April 2026: NBS first quarter release, showing whether service robot growth recovers once the holiday distortion passes.
- Monthly through 2026: NBS industrial robot growth staying above or falling below the 28.0% pace of 2025.
- September 2026: IFR World Robotics 2026, with 2025 installations for China and the share held by Chinese suppliers.
- 28 February 2026
- 18,581,081 sets, +16.1%
- 556,000 sets, +14.2%
- 773,074 sets, +28.0% (comparable basis)
- 295,000 units, 54% of global
- 2,547,480 sets, +1.0%
- 90,116 sets, +14.7%
- 143,608 sets, +31.1%
- 57%
Why it matters
The NBS communique is the only official, economy wide count of robot production in China, and the 2025 figure confirms that the country's robot industry is growing several times faster than its economy. A 28.0% rise in industrial robot output in a year when GDP grew 5.0% and equipment manufacturing 9.2% places robotics among the fastest growing physical product lines Beijing measures.
The early 2026 data matter as much as the annual total. Industrial robots accelerated to 31.1% in January and February, while service robots slowed to 1.0%. For investors who have priced Chinese embodied AI companies on consumer and service adoption, the official series is now flashing a different signal from the factory automation series.
Rival analysis
Against other large markets the contrast is stark. The IFR counted 2024 installations falling 4% in Japan to 44,500, 9% in the United States to 34,200, 3% in South Korea to 30,600 and 5% in Germany to 26,982, while China absorbed 295,000. Japanese and European makers that long dominated China now face a home market where, by the IFR's count, Chinese suppliers held 57% in 2024.
The NBS does not name companies. The financial reports of listed Chinese robot makers such as Estun Automation are the places where the official volume growth should appear first in disclosed sales and margins.
Valuation context
The statistics give no price data, so volume growth cannot be translated directly into market value. If average selling prices fell while units rose 28%, sector revenue could have grown far less than output, a possibility the official data can neither confirm nor rule out.
For public market valuations of Chinese robotics names, the relevant comparison is between implied revenue growth and official volume growth. Companies growing robot revenue well below 28% in 2025 are likely losing share or cutting prices; those above it are taking share in an expanding market.
Supply-chain implications
Industrial robot output at this scale pulls through reducers, servo motors, controllers and encoders. Sun Xiao of the NBS tied 8.9% growth in general equipment manufacturing in early 2026 partly to faster robot production, which indicates the upstream effect is already visible in official data.
The same component base serves humanoid developers. A larger, cheaper domestic supply of precision reducers and servo drives can lower bill of materials costs for humanoid makers.
Signals to watch
The NBS first quarter release in mid April 2026 will show whether service robot growth recovers after the Spring Festival distortion. A March figure well above 1.0% would support the holiday explanation; a second weak reading would point to a genuine slowdown.
The IFR's World Robotics 2026 report in September will give 2025 installations for China and an updated domestic supplier share, allowing a comparison with the NBS output trend and an estimate of how much production went to export.
Analyst view
Thesis: China's 2025 robot growth was driven by industrial automation sold increasingly by domestic brands, and the service robot data do not yet support a consumer led robot cycle. Confidence: medium.
The confidence is medium rather than high because the NBS series has known limits: shifting enterprise coverage, no product breakdown, no prices and no humanoid line. The two month service robot reading includes the Spring Festival, and one weak print is not a trend. The industrial robot conclusion rests on three consistent data points and corroborating IFR installation data, which is why it carries more weight than the service robot signal.
Questions you should be asking
How much of the 773,074 industrial robots made in China in 2025 were exported, and to which markets? The NBS does not say, and customs data use different product codes.
What explains the gap between raw totals and comparable growth rates, especially for service robots, where the ratio of 2025 to 2024 totals implies far faster growth than the official 16.1%? A clearer statement of how many enterprises entered the survey would help users interpret the series.