FANUC lifts forecast past ¥1 trillion, but robots trail its CNC boom
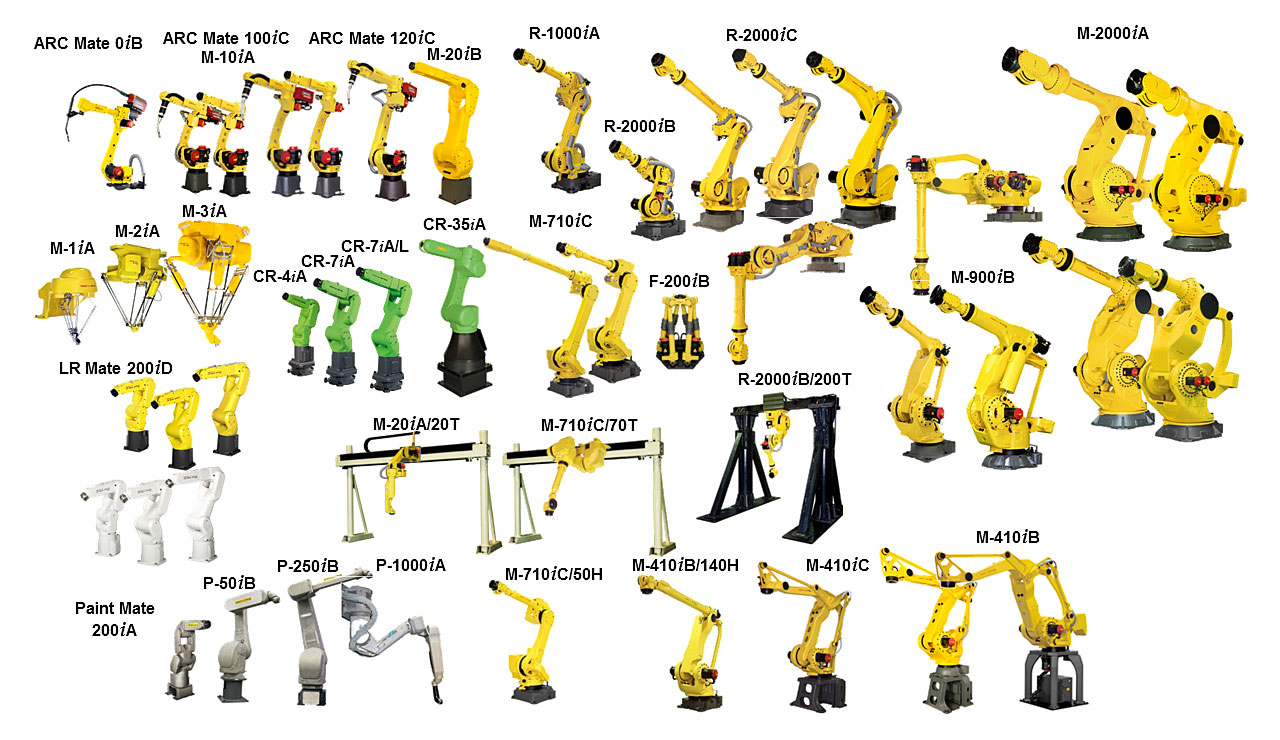
FANUC raised its full-year sales forecast to ¥1,013.7 billion, its first year above ¥1 trillion, after second-quarter operating income rose 45.1% to ¥63.2 billion, the company said in results published on Oct 23.
The growth came mostly from CNC controls and machine tools for AI data centres, chips and humanoid-robot parts: factory-automation orders rose 130.1% while robot orders rose 12.6%, and robot sales in China fell 14.3%.
FANUC expects to sell more than ¥1 trillion of equipment in a fiscal year for the first time. In results published on Oct 23, the Japanese automation maker raised its forecast for the year to March 2027 to ¥1,013.7 billion of sales, up from ¥948.1 billion, with operating income of ¥240.7 billion instead of ¥218.0 billion and net income of ¥228.3 billion instead of ¥198.0 billion. The robot arms that most people associate with the yellow FANUC brand are not what drove the upgrade.
A record quarter carried by controls, not robots
In the July to September quarter, sales rose 14.9% from a year earlier to ¥242.7 billion and operating income rose 45.1% to ¥63.2 billion, an operating margin of 26.0%, according to the company's reference material. Orders jumped 49.0% to ¥306.0 billion. The factory-automation division, which makes CNC controls, servo motors and lasers for machine-tool builders, booked ¥112.2 billion of orders, up 130.1%. Robomachine orders (ROBODRILL, ROBOSHOT, ROBOCUT) rose 72.3%. Robot orders rose 12.6% to ¥103.4 billion, and robot sales rose 7.2% to ¥98.2 billion.
- FA (CNC, servos, lasers)
- 112.2
- +130.1%
- 62.5
- +15.4%
- Robot
- 103.4
- +12.6%
- 98.2
- +7.2%
- Robomachine
- 51.2
- +72.3%
- 41.6
- +40.8%
- Service
- 39.3
- +12.0%
- 40.3
- +12.5%
- Total
- 306.0
- +49.0%
- 242.7
- +14.9%
Source: FANUC financial results reference material, Oct 23, 2026. Disclosed figures.
As of Oct 23, 2026
FANUC said demand for its controls is led by China, where AI data centres, semiconductors, humanoid-robot components and electric vehicles are driving machine-tool purchases, with Japan, Korea and Taiwan also strong. For robots, it pointed to sharply rising automation investment, including AI-related demand, in the Americas and China, and said automotive spending in the Americas is starting to pick up.
Where the robot business grew and where it shrank
The regional split of robot sales shows a less even picture. Robot sales in the Americas rose 11.8% to ¥46.0 billion and now make up 46.8% of the division. Sales in China fell 14.3% to ¥18.1 billion and were 32.0% below the first quarter. Europe grew 4.4%.
- Americas
- 46.0
- 46.8%
- +11.8%
- Europe
- 19.2
- 19.5%
- +4.4%
- China
- 18.1
- 18.4%
- -14.3%
- Japan
- 7.0
- 7.1%
- +21.8%
- Asia excluding China
- 6.8
- 6.9%
- +65.7%
Source: FANUC reference material, Oct 23, 2026. Rest of world ¥1.3bn not shown.
As of Oct 23, 2026
The weak yen flatters every growth rate. FANUC's average rate in the quarter was ¥159.25 to the dollar against ¥147.48 a year earlier. Translated at those averages, robot sales were about $617 million against $621 million, roughly flat in dollar terms (MEKAWIRE calculation; a rough gauge, since not all robot sales are in dollars). For the second half FANUC assumes ¥150 to the dollar, so part of the tailwind is already priced out of the new forecast.
MEKAWIRE analysis
Japan's two largest robot makers are now growing fastest in the parts of their business that sit one step behind the robot, and the robot divisions are shrinking as a share of the group.
Robots were 44.7% of FANUC's orders a year ago and 33.8% this quarter. Yaskawa Electric reported the same shift on Oct 9: its motion-control business grew 21.7% and overtook robotics, whose first-half profit fell 43.3% (MEKAWIRE explainer on Yaskawa's results). Both companies are selling more servos, drives and controls into chip, data-centre and humanoid supply chains than they are selling finished robot arms.
- FANUC
- Jul to Sep 2026
- Sales +7.2%, orders +12.6%
- FA orders +130.1%, sales +15.4%
- Yaskawa Electric
- Mar to Aug 2026
- Sales -0.7%, operating profit -43.3%
- Motion control sales +21.7%, profit +32.8%
Sources: FANUC results Oct 23, 2026; Yaskawa first-half results Oct 9, 2026 (MEKAWIRE coverage). Robot share of FANUC orders = robot orders / group orders: 103.4 / 306.0 = 33.8%.
As of Oct 23, 2026
The counter-argument is in the order book: FANUC's robot orders still grew faster than robot sales, and Yaskawa's robot orders rose 33% in its second quarter, so the arm business may be turning rather than stalling. The China number is the one to watch. FANUC sells CNC controls into Chinese factories that make humanoid joints and reducers while its own robot sales there fall, which suggests local robot brands are taking share even as the component boom lifts Japanese suppliers. Our Japan physical-AI strategy explainer covers how FANUC is answering with partnerships rather than humanoids of its own.
What to watch
FANUC's third-quarter results in late January will show whether robot orders in the Americas convert into sales and whether China robot sales recover from the September quarter. The Japan Robot Association's quarterly orders release, due in late October, will show whether the country's robot exports follow FANUC's regional mix; our Japan robotics market explainer tracks the annual figures.
- ¥306.0 billion, up 49.0%
- ¥103.4 billion, up 12.6%; 33.8% of group orders (44.7% a year earlier)
- Oct 23, 2026
- ¥63.2 billion, up 45.1%; margin 26.0%
- ¥1,013.7 billion (previously ¥948.1 billion), first year above ¥1 trillion
- ¥18.1 billion, down 14.3% year on year and 32.0% on the quarter
- ¥242.7 billion, up 14.9%
- ¥240.7 billion (previously ¥218.0 billion)