IFR counts 542,000 factory robots installed in 2024 as Japan, Korea and Germany slip and China takes 54%
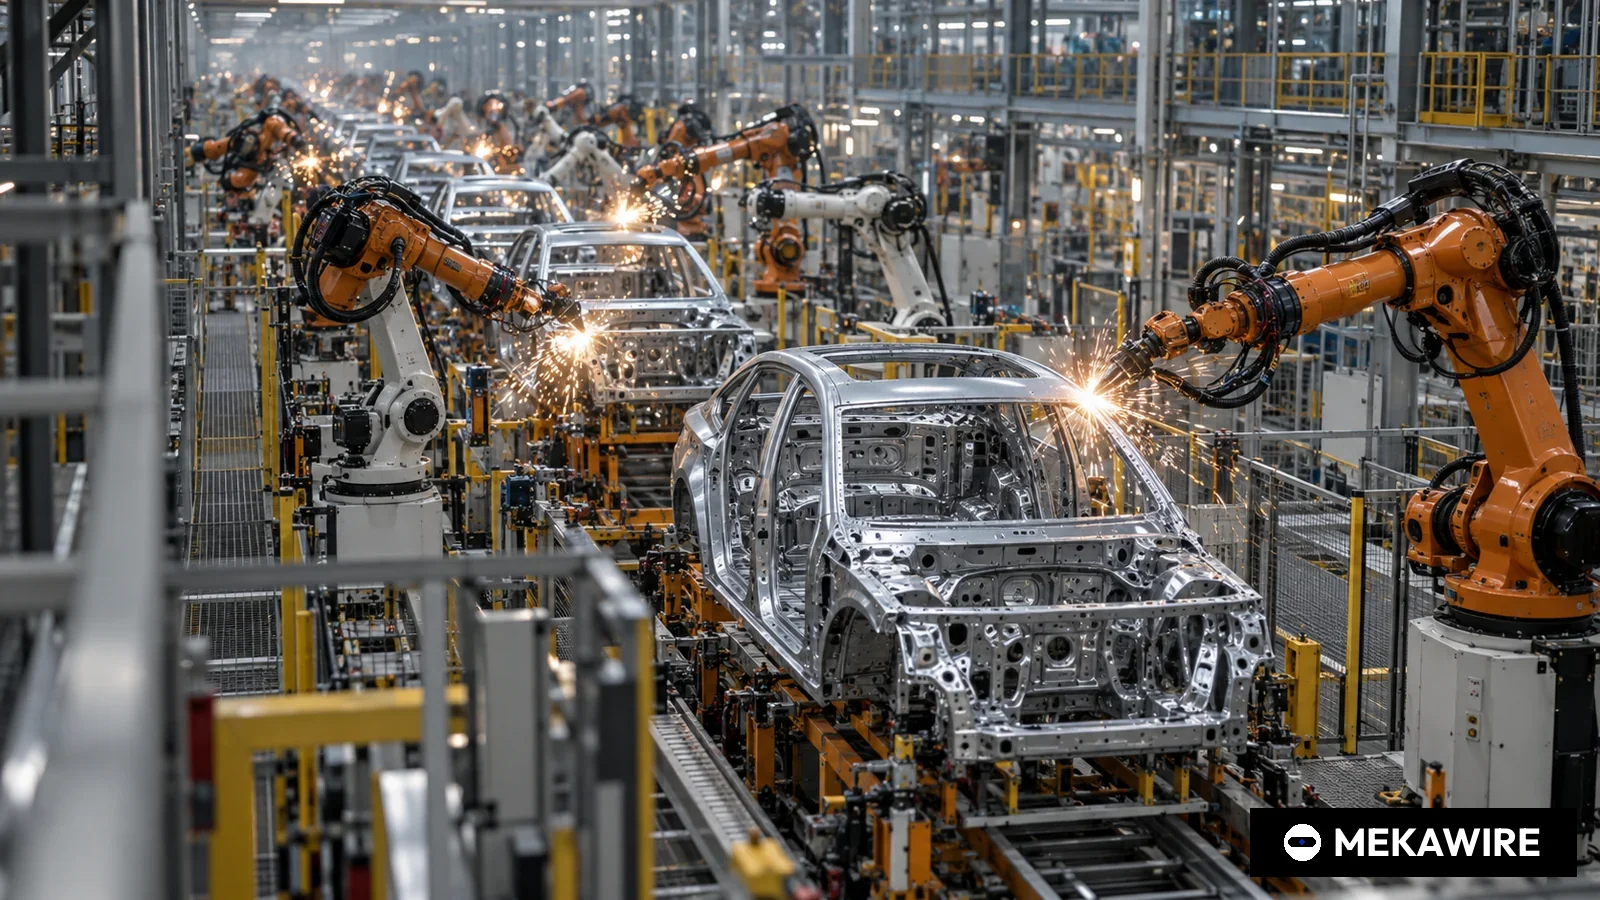
The International Federation of Robotics said on 25 September 2025 that 542,000 industrial robots were installed worldwide in 2024, the second-highest annual total on record and 2% below 2023. Japan (44,500 units, down 4%), the Republic of Korea (30,600, down 3%) and Germany (26,982, down 5%) all contracted, while China installed 295,000 units and domestic Chinese makers took 57% of their home market for the first time.
The International Federation of Robotics (IFR) said on 25 September 2025 that factories worldwide installed 542,000 industrial robots in 2024, the second-highest annual count in its records and 2% below the 2023 peak. The Frankfurt-based federation, presenting its World Robotics 2025 report, said annual installations have now topped 500,000 units for four years running and that the operational stock of industrial robots rose 9% to 4,664,000 units.
The headline masks a sharp regional split. Asia accounted for 74% of new deployments in 2024, Europe for 16% and the Americas for 9%, according to the IFR. China alone installed 295,000 units, a record and 54% of the global total, and its operational stock passed 2 million robots. The three established robot nations outside China all went backwards: Japan installed 44,500 units (down 4%), the Republic of Korea 30,600 (down 3%) and Germany 26,982 (down 5%).
What the IFR reported
Japan kept its place as the world's second-largest market, with its operational stock up 3% to 450,500 units, the IFR said. The federation expects Japanese installations to grow at lower single-digit rates in 2025 before accelerating to medium single-digit growth. Korea ranked fourth by annual installations, behind the United States, which installed 34,200 units, down 9%. Germany remained Europe's largest market and the fifth-largest in the world, taking 32% of European installations; the IFR described the 2024 German result as the second-best on record after 2023.
Elsewhere in Europe the picture was weaker. Total European installations fell 8% to 85,000 units, with 80% of them (67,800 units) inside the European Union. Italy, the region's second-largest market, fell 16% to 8,783 units. Spain moved into third place with 5,100 units on automotive demand, France dropped to fourth after a 24% decline to 4,900 units, and the United Kingdom fell 35% to 2,500 units after a 2023 surge driven by the super-deduction tax incentive. India grew 7% to a record 9,100 units and became the sixth-largest market.
By industry, the IFR's President's Report said electrical and electronics customers regained the lead with a 2% increase, while automotive installations fell 7% and general industry rose 3%. The report put 2014 installations at 221,000 units, which means annual demand has more than doubled in a decade. "The new World Robotics statistics show 2024 the second highest annual installation count of industrial robots in history," IFR President Takayuki Ito said in the release.
Why the China number matters for Japan, Korea and Europe
The most consequential line in the release concerns suppliers rather than buyers. The IFR said that for the first time Chinese manufacturers sold more robots in China than foreign suppliers did, lifting their domestic market share to 57%. By that measure foreign suppliers, a group that includes Japan's Fanuc, Yaskawa Electric and Kawasaki Heavy Industries as well as KUKA and ABB Robotics, now hold 43% of the world's largest robot market, a MEKAWIRE calculation (100% minus 57%). A MEKAWIRE calculation from the IFR figures shows Japan, Korea and Germany together installed 102,082 units in 2024, or 18.8% of the world total, about a third of China's volume.
For Korea the data cut both ways. The country's 30,600 installations sit against the world's highest robot density, which the IFR put at 1,012 robots per 10,000 manufacturing employees in 2023, against 470 in China, 429 in Germany and 419 in Japan. A mature, highly automated base leaves less room for volume growth, and the 3% decline suggests replacement and new-line demand from electronics and automotive did not offset softer investment in 2024.
Outlook and open questions
The IFR forecasts global installations to rise 6% to 575,000 units in 2025 and to pass 700,000 units a year by 2028. It cited OECD and IMF expectations of 2.9% to 3.1% world growth in 2025 and 2026, and flagged geopolitical tension, wars in Eastern Europe and the Middle East, and trade disruption as headwinds. The federation did not publish 2025 forecasts by country in the release, so whether Germany, Japan and Korea share in the rebound remains open.
MEKAWIRE analysis
The 2024 statistics mark the year the world's robot market stopped being a growth story for Japanese, Korean and German producers at home and became a contest for share in a China-centred market they no longer lead.
The evidence is in the IFR's own split: China grew 7% while Japan, Korea, Germany, the United States, Italy and France all declined, and Chinese suppliers crossed 57% of China's market. With Japan's stock growing just 3% and Germany's installations below their 2023 record, the incumbents' home markets are in replacement mode. The strongest counter-argument is cyclical: automotive installations fell 7% in 2024, and the IFR expects a 6% global recovery in 2025 and over 700,000 units by 2028, a rise of at least 29.2% on 2024 by MEKAWIRE calculation, which would lift every major market.
Bull case: Japanese and European makers keep the high end, where precision, reliability and integration count, and the forecast growth to 2028 plus labour shortages in Japan, Korea and Germany revive home demand from 2025. Korea's density lead becomes an export showcase for its integrators and cobot makers.
Bear case: Chinese suppliers use a 295,000-unit home market to drive down cost and move up into automotive and electronics lines abroad, squeezing margins at Fanuc, Yaskawa, KUKA and ABB. European volumes, already 8% lower, stagnate as automotive capex stays weak.
Signals to watch:
- November 2025: ISR and Robot World 2025 in Seoul, flagged by the IFR President, for Korean order sentiment and new cobot and humanoid launches.
- December 2025: iREX in Tokyo, also flagged by the IFR, where Japanese makers present their product response to lower-cost Chinese rivals.
- World Robotics 2026, due on the IFR's September cycle (the last two editions came on 24 September 2024 and 25 September 2025), which will show whether the 575,000-unit forecast for 2025 held and whether the Chinese supplier share rose above 57%.
- China
- 295,000
- 7
- 54.4
- 276,288
- 470
- Japan
- 44,500
- -4
- 8.2
- 46,106
- 419
- United States
- 34,200
- -9
- 6.3
- 37,587
- 295
- Republic of Korea
- 30,600
- -3
- 5.6
- 31,444
- 1012
- Germany
- 26,982
- -5
- 5
- 28,355
- 429
- Italy
- 8,783
- -16
- 1.6
- 10,412
- No data
- France
- 4,900
- -24
- 0.9
- 6,386
- No data
- World
- 542,000
- -2
- 100
- 541,302
- 162
Sources: IFR World Robotics 2025 press release and President's Report (25 Sep 2025) for 2024 units and changes; IFR World Robotics 2024 release (24 Sep 2024) for 2023 units; IFR robot density release (20 Nov 2024) for density. Share of world installs is a MEKAWIRE calculation: market installations 2024 / 542,000 x 100, rounded to one decimal. IFR may revise prior-year figures, so the IFR-stated percentage change is shown rather than a recalculation. Density for Italy and France was not given in the release used (—). All figures disclosed, none estimated.
As of Oct 1, 2026
- 295,000 units (54% of world); Chinese makers 57% of home market
- 44,500 units, down 4%; stock 450,500, up 3%
- 85,000 units, down 8%; EU 67,800
- 26,982 units, down 5%; 32% of Europe
- IFR World Robotics 2025, Frankfurt, 25 September 2025
- 575,000 units in 2025 (+6%); over 700,000 by 2028
- 30,600 units, down 3%; fourth-largest market
- 4,664,000 units, up 9%
- 542,000 units, down 2%, second-highest on record
Why it matters
World Robotics is the only global census of industrial robot installations, and the 2025 edition is the first in which the IFR records Chinese suppliers outselling foreign ones in China. For Japanese, Korean and German producers this changes the arithmetic of growth: their own home markets declined in 2024 (Japan down 4%, Korea down 3%, Germany down 5%), and the one market that grew, China at 7%, is now majority-supplied by local makers.
The numbers also reset expectations for policy makers in Seoul, Tokyo and Berlin, each of which has made robotics a pillar of industrial strategy. Germany's 26,982 units were its second-best year, so the decline is from a high base, but Europe as a whole lost 8% and its second, fourth and fifth markets (Italy, France, the UK) fell between 16% and 35%.
Rival analysis
The IFR release does not break out installations by supplier, so company market shares cannot be read from it. What it does establish is the battlefield: 295,000 units in China against 44,500 in Japan, 34,200 in the United States, 30,600 in Korea and 26,982 in Germany. By MEKAWIRE calculation China installed 6.6 times as many robots as Japan (295,000 / 44,500) and 3.5 times as many as all of Europe (295,000 / 85,000).
For Fanuc, Yaskawa Electric, Kawasaki Heavy Industries, KUKA and ABB Robotics, the 57% Chinese supplier share means competing for a 43% slice of China while home demand is flat to down. Korean makers such as Doosan Robotics and Rainbow Robotics face a home market that is the world's most automated by density yet shrank 3% in 2024, which raises the importance of overseas channels.
Valuation context
The release contains no financial data. For listed robot makers, the implication is that 2024 unit demand in their core developed markets did not support volume-led growth, and that 2025 guidance rests on the IFR's projected 6% global recovery, which is itself driven largely by Asia.
Investors pricing a multi-year upcycle should note the IFR's forecast of more than 700,000 units by 2028, which by MEKAWIRE calculation implies at least 29.2% growth over 2024 ((700,000 / 542,000) minus 1). How much of that accrues to non-Chinese suppliers is the open valuation question.
Supply-chain implications
Robot installations pull demand for precision reducers, servo motors, controllers and sensors, segments in which Japanese firms such as Nabtesco and Harmonic Drive Systems operate. A shift of China's demand toward domestic robot makers raises the question of whether those makers also source components locally, which the IFR data do not address.
In Europe, the IFR attributed Spain's rise to third place to strong automotive demand, while automotive installations fell 7% worldwide. That combination suggests vehicle investment decisions, more than general economic growth, set the pace for European robot volumes in 2024.
Signals to watch
ISR and Robot World 2025 in Seoul in November 2025 and iREX in Tokyo in December 2025, both named in the IFR President's Report, are the next venues where Korean and Japanese makers will show order momentum and new products.
The IFR's next robot density ranking (the previous one was released on 20 November 2024) will show whether Korea's 1,012 robots per 10,000 employees keeps rising despite lower installations. The World Robotics 2026 report will test the 575,000-unit forecast for 2025 and the trajectory of the 57% Chinese supplier share.
Analyst view
Thesis: the 2024 data show structural share loss for Japanese, Korean and European robot makers in the world's largest market, layered on a cyclical slump in their home markets. Confidence: medium.
Reasons for medium rather than high confidence: the IFR describes the China supplier shift as a first, so one year does not make a trend; automotive weakness in 2024 is plausibly cyclical; and the IFR expects growth to resume in 2025. Reasons it is not low: the decline was broad across every major non-Chinese market listed in the release, and Europe as a region fell 8%.
Questions you should be asking
Will Chinese suppliers' 57% domestic share translate into export gains in Japan, Korea or Europe, which the IFR statistics would show as import origin data in later editions?
Can Japan's forecast return to medium single-digit growth after 2025 offset its labour shortage pressures, and will Germany's automotive investment recover enough to lift European installations back above 2023 levels?