Harmonic Drive Systems explained: robots are only a quarter of its orders, and a surgical order and chip tools drove its 56% jump
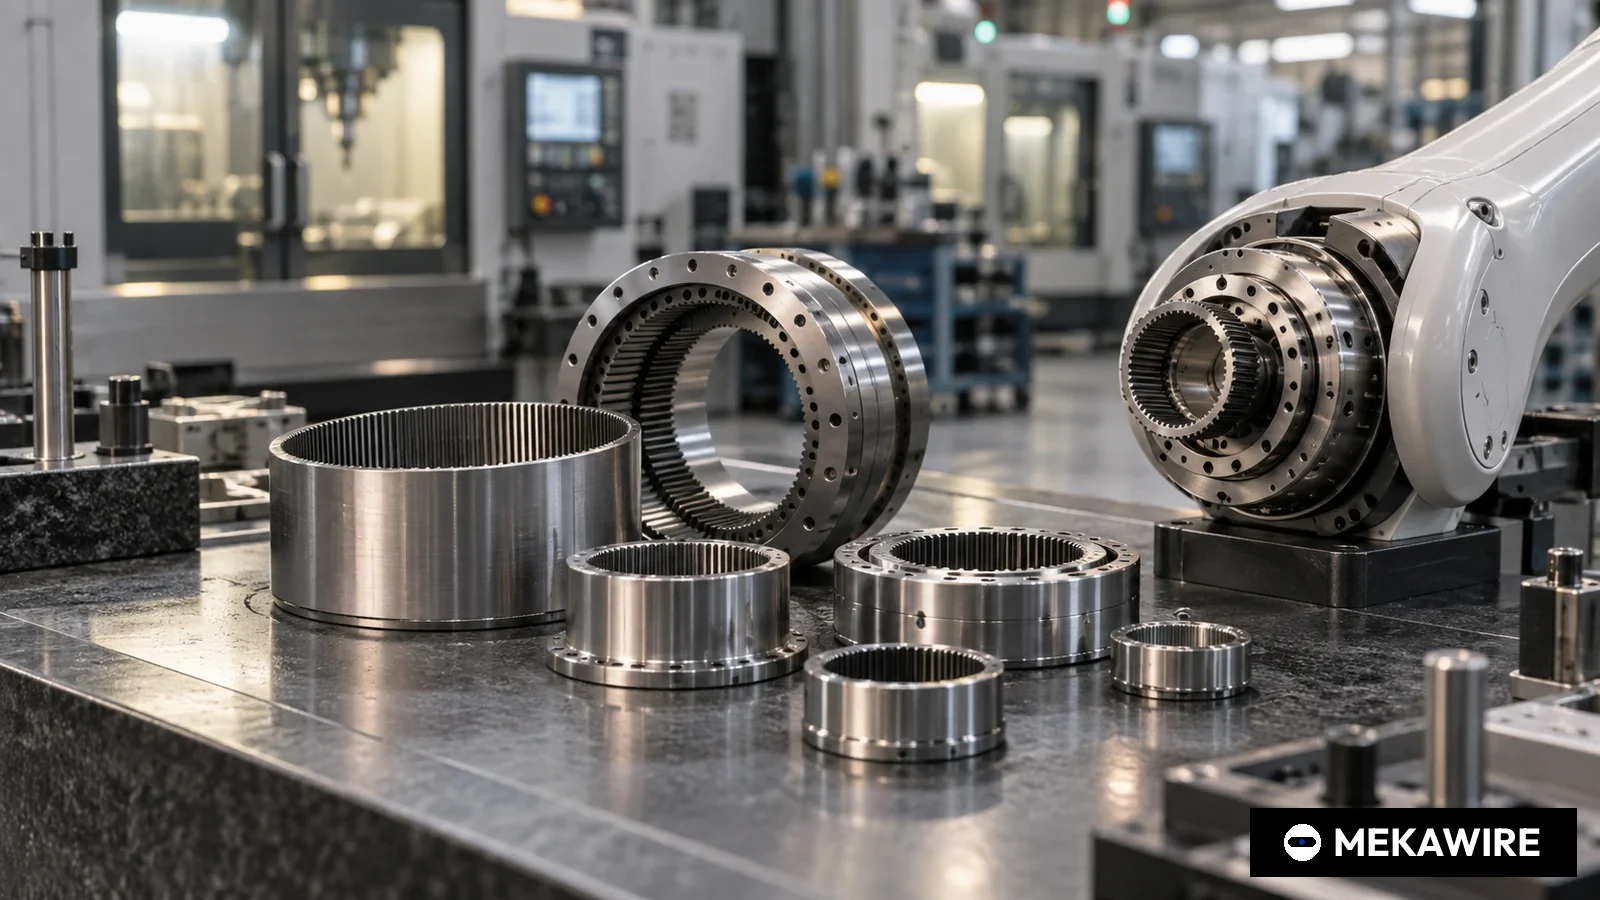
Harmonic Drive Systems, the Tokyo maker of the strain-wave gears used in robot joints, took ¥24.1 billion of orders in April to June 2026, up 55.7%, but industrial robots accounted for about a quarter of them, according to its filings.
Its own results credit a large North American surgical-robot order and chip-equipment demand, and its operating margin rose from 0.9% to 11.0% because sales are refilling factories it had already built.
Harmonic Drive Systems is the company most often named when investors ask who makes the gears inside robot joints, yet in its best quarter in years industrial robots supplied only about a quarter of its new orders. The Tokyo maker of strain-wave gears booked ¥24.1 billion of orders in April to June 2026, up 55.7%, and its backlog reached ¥29.5 billion, up 45.6%, the company said in its quarterly filing on Aug 7. Its application chart puts industrial-robot orders at ¥6.1 billion of that total.
That gap matters for anyone treating the stock or its order book as a proxy for humanoids and robot arms. This explainer uses the company's annual and quarterly filings, its forecast revision and its results presentation to answer three questions: what Harmonic Drive actually sells, what drove the 2026 rebound, and why its margin is rising four times faster than its sales.
A gear that flexes, sold mostly as a component
A strain-wave gear trades motor speed for torque by flexing a thin toothed steel cup inside a rigid ring, giving a high reduction ratio with almost no backlash in a small package. That combination is why it sits in robot wrists, elbows and shoulders, in chip-wafer handling robots and in surgical arms. Harmonic Drive sells it under the HarmonicDrive brand, along with other reducers and complete actuator units it calls mechatronics products. In the year to March 2026, reducers brought in ¥46.3 billion, 77.8% of sales of ¥59.6 billion, and mechatronics ¥13.2 billion, the company said. It reports by location, not by customer industry: Japan, China, North America and Europe, the last mainly its European unit Harmonic Drive SE, whose purchase still costs about ¥1 billion a year in amortisation.
So which customers are buying now?
The jump came from a surgical order and chip tools as much as robots
The filing names the drivers itself: steady automation spending, a large order in North America for surgical-robot use, and chip-equipment demand linked to generative AI. The segment table shows where the money landed. North American mechatronics orders rose 336.2% to ¥4.4 billion and its backlog 176.2% to ¥5.3 billion. Japan's reducer orders rose 51.3% to ¥8.9 billion. China fell: reducer orders there dropped 27.8%, and the company says industrial-robot orders in China declined.
- Japan
- Reducers
- 8,857
- +51.3%
- 7,146
- +73.2%
- Japan
- Mechatronics
- 1,193
- +58.8%
- 1,287
- +41.1%
- China
- Reducers
- 981
- -27.8%
- 980
- -5.4%
- China
- Mechatronics
- 149
- +33.9%
- 119
- +23.4%
- North America
- Reducers
- 2,663
- +25.3%
- 5,259
- +29.0%
- North America
- Mechatronics
- 4,416
- +336.2%
- 5,330
- +176.2%
- Europe
- Reducers
- 4,309
- +26.4%
- 6,947
- +13.5%
- Europe
- Mechatronics
- 1,555
- +77.3%
- 2,385
- +23.7%
- Total
- No data
- 24,128
- +55.7%
- 29,457
- +45.6%
From the order table in the Aug 7 quarterly filing. Segments are by location of the selling company. Changes are year on year.
As of Oct 18, 2026
Industrial robots did grow. Robot orders rose 26.5% to ¥6.1 billion and robot sales 19.2% to ¥4.9 billion, 29.5% of the quarter's sales, according to the presentation chart. Strip out North American mechatronics and total orders still rose about 36%, by MEKAWIRE's calculation from the segment table. Demand is broad, then, but the headline figure leans on one region and one product line. The more interesting number is what that demand did to profit.
Why profit rose fifteenfold on 24% more sales
Operating profit rose to ¥1.84 billion from ¥122 million, lifting the margin from 0.9% to 11.0%. Of the ¥3.19 billion of added sales, ¥1.72 billion, or 54%, became operating profit. The company credits higher plant utilisation in Japan, where the segment margin went from about 17% to 26.8%. The explanation sits in the cash-flow statement: in the year to March 2026 Harmonic Drive spent ¥4.8 billion on capital goods while charging ¥7.4 billion of depreciation, and for the current year it plans ¥6.6 billion of capex against ¥7.1 billion of depreciation. The capacity is already paid for, so each extra gear sold carries little added cost.
- FY to Mar 2025
- 55,645
- 6
- 0.0%
- n/a
- 3,473
- FY to Mar 2026
- 59,557
- 2,567
- 4.3%
- 61,613
- 1,608
- Q1 FY to Mar 2026 (Apr to Jun 2025)
- 13,496
- 122
- 0.9%
- 15,501
- -38
- Q1 FY to Mar 2027 (Apr to Jun 2026)
- 16,681
- 1,840
- 11.0%
- 24,128
- 1,274
- FY to Mar 2027 forecast (Aug 7)
- 74,500
- 8,500
- 11.4%
- not guided
- 6,000
From the company's results filings of May 13 and Aug 7, 2026, the forecast revision of Aug 7 and the Q1 presentation (prior-year Q1 orders). Net profit attributable to owners of the parent. Margin = operating profit / net sales. n/a = not in the documents used.
As of Oct 18, 2026
The company raised its full-year forecast on Aug 7 to ¥74.5 billion of sales and ¥8.5 billion of operating profit, an 11.4% margin, from ¥68.0 billion and ¥6.2 billion in May. Part of the lift is currency: the dollar assumption moved to ¥156.59 from ¥147.50 and the euro to ¥179.76 from ¥170.00. The remaining nine months must deliver ¥57.8 billion of sales at an 11.5% margin, slightly above the first quarter. That is achievable on the current backlog, which equals 1.77 quarters of sales. How does that compare with the rest of the reducer trade?
Nabtesco is bigger, Leaderdrive grows faster
- Harmonic Drive Systems (JP)
- Apr to Jun 2026
- Group net sales
- ¥16.68bn
- +23.6%
- Operating margin 11.0%
- Harmonic Drive Systems (JP)
- FY to Mar 2026
- Reducer sales
- ¥46.33bn
- +9.5%
- Group operating margin 4.3%
- Nabtesco (JP)
- Calendar 2025
- Precision reduction gear sales
- ¥78.6bn
- 2026 forecast ¥88.2bn (+12.2%)
- Component segment operating margin 6.8%
- Leaderdrive (CN)
- Jan to Jun 2026
- Revenue
- 348.55m yuan
- +38.64%
- Net margin 20.1%
- Leaderdrive (CN)
- Calendar 2025
- Revenue
- 570.71m yuan
- +47.31%
- Net margin 21.8%
Verified MEKAWIRE rows from company filings (HDS results; Nabtesco FY2025 results briefing; Leaderdrive annual report summary and CITIC Securities sponsor filing). Disclosed figures, not estimates. Fiscal periods differ. Net margin = net profit / revenue. HDS reducer sales = 59% of Nabtesco's reducer sales; Leaderdrive 2025 revenue = about ¥12.9bn at HDS's own forecast assumption of ¥22.52 per yuan, 22% of HDS group sales (MEKAWIRE calculations).
As of Oct 18, 2026
Nabtesco, which estimates its cycloidal RV gears hold about 60% of medium and large industrial-robot joints, sold ¥78.6 billion of precision reduction gears in 2025 and forecasts ¥88.2 billion for 2026, so Harmonic Drive's reducer revenue is about 59% of its rival's. Nabtesco's component segment earned a 6.8% margin in 2025, below Harmonic Drive's current run rate. Leaderdrive in Suzhou is the challenger: revenue rose 47.31% in 2025 to 570.71 million yuan and 38.64% in the first half of 2026, with net margins near 20%, and its annual report calls it a core supplier to several embodied-AI robot makers. At Harmonic Drive's own forecast rate of ¥22.52 per yuan, Leaderdrive is about a fifth of Harmonic Drive's size, but it is growing roughly twice as fast. Customers matter too: Yaskawa Electric, a large robot-arm maker, reported robot orders up 33% in its June to August quarter while its robot margin fell to 5.0% in the half.
MEKAWIRE analysis
Harmonic Drive's 2026 rebound is an operating-leverage story built on surgical, chip and robot demand at once; the humanoid business that draws investors to the name is real but too small to see in its numbers.
The evidence for that view is in the filings: robots are 25% of orders, the largest single jump came from a surgical customer, and the margin recovery comes from filling plants whose depreciation already exceeds new spending. The company did say in May that it won orders from customers moving AI-driven robots into mass production, and in North America orders for AI robots offset weaker defence orders last year. It has not said how large those orders are.
The strongest counter-argument is that the AI-robot orders could be hiding inside the North American and mechatronics lines, which would make humanoid demand bigger than the robot chart suggests. If that is so, the next quarters will show it as recurring, not one-off, mechatronics orders.
Bull case: chip tools, surgical robots and a recovering robot cycle keep the book-to-bill near 1.45, the margin climbs above the forecast 11.4%, and AI-robot volume adds on top. Bear case: the surgical order proves lumpy, China keeps shrinking and Leaderdrive takes price-sensitive share, so sales flatten while the forecast still assumes 25% growth.
Signals to watch: the July to September quarterly filing, which will show whether the raised first-half forecast of ¥35.7 billion of sales and ¥3.7 billion of operating profit holds; whether North American mechatronics orders stay above ¥4 billion in a second quarter; and Nabtesco's and Leaderdrive's next results, which show whether Harmonic Drive's growth is share gain or a rising tide.
- Harmonic Drive Systems took ¥24,128 million of orders in April to June 2026, up 55.7%, and its backlog reached ¥29,457 million, up 45.6%, according to its Aug 7 quarterly filing.
- Industrial robots accounted for ¥6,123 million of those orders (25.4%) and ¥4,920 million of sales (29.5%), per the application chart in its results presentation; robot orders rose 26.5% and robot sales 19.2%.
- North American mechatronics orders rose 336.2% to ¥4,416 million; the company cites a large order for surgical-robot use in North America and chip-equipment demand tied to generative AI.
- Excluding North American mechatronics, orders still rose about 36% (MEKAWIRE calculation from the filing's segment table).
- Operating profit rose to ¥1,840 million from ¥122 million, an 11.0% margin against 0.9%; 54% of the added sales fell through to operating profit (MEKAWIRE calculation).
- For the year to March 2026 sales were ¥59,557 million (+7.0%), operating profit ¥2,567 million (4.3% margin) after ¥6 million a year earlier, and orders ¥61,613 million (+16.2%), including mass-production orders from customers building AI robots.
- On Aug 7 the company raised its forecast for the year to March 2027 to ¥74.5 billion of sales and ¥8.5 billion of operating profit (11.4%), from ¥68.0 billion and ¥6.2 billion, with the assumed dollar rate moved to ¥156.59 from ¥147.50.
- Planned capital spending of ¥6.6 billion is below planned depreciation of ¥7.1 billion; in the year to March 2026 capex was ¥4.8 billion against ¥7.4 billion of depreciation.
Why it matters
Harmonic Drive Systems is the reference supplier for strain-wave gears, the component that sets the size, weight and accuracy of a robot's wrist and arm joints. Its order book is read across the industry as an early indicator of robot-arm and humanoid build plans. The first-quarter numbers show that the indicator is now mixed with surgical-robot and chip-equipment demand, so it has to be decomposed before it says anything about robots.
For investors the practical point is that the company's earnings power is driven by utilisation of plants already built. That makes profit highly sensitive to volume in both directions, as the 0.0% margin of the year to March 2025 showed.
Rival analysis
Nabtesco is the larger reducer maker by revenue, ¥78.6 billion of precision reduction gears in 2025 against Harmonic Drive's ¥46.3 billion of reducers, and it supplies a different joint type, the heavier cycloidal RV gear. The two overlap less than their names suggest: Nabtesco is strongest in the base and shoulder of large industrial robots, Harmonic Drive in compact wrists, cobots, wafer robots and surgical arms.
Leaderdrive is the direct strain-wave competitor. It is about a fifth of Harmonic Drive's size by revenue at the company's own yen-yuan assumption, but grew 47.31% in 2025 and 38.64% in the first half of 2026 with net margins around 20%. Harmonic Drive's China reducer orders fell 27.8% in the same quarter that Leaderdrive kept growing, which is consistent with domestic substitution, though neither company states it. Timken, through Cone Drive, is a smaller harmonic-gear rival in lighter duty joints.
Valuation context
This explainer does not use a market value. The fundamentals that a valuation rests on moved sharply: the forecast operating margin went from 4.3% last year to 11.4% this year, and earnings per share are guided to ¥63.38 from ¥16.99. Net profit last year was depressed by ¥5.8 billion less gain on securities sales than the year before, so the year-on-year profit comparison flatters the recovery less than the operating line does.
The balance sheet is conservative, with an equity ratio of 71.9% at the end of June. The company targets a payout ratio of about 35% and guides a ¥20 dividend, unchanged despite the raised profit forecast.
Supply-chain implications
Production sits mainly in Japan, with manufacturing in North America and Europe through its subsidiaries; the China segment shows no production in the quarter, only sales. Japan produced ¥8.8 billion of reducers at selling prices in the quarter, 52% of group output of ¥17.1 billion. That concentration means the yen rate drives reported sales and margins: the forecast now assumes ¥156.59 to the dollar and ¥179.76 to the euro.
The company cites rising material and labour costs and says it raised product prices last year. Capital spending is planned at ¥6.6 billion, below depreciation of ¥7.1 billion, so capacity additions are modest. A sustained humanoid ramp would test that stance faster than the industrial cycle.
Signals to watch
The July to September filing: first-half sales of ¥35.7 billion and operating profit of ¥3.7 billion would require about ¥19.0 billion of sales and ¥1.9 billion of profit in the second quarter. North American mechatronics orders: a second quarter above ¥4 billion would point to recurring surgical or AI-robot demand rather than a single order. China reducer orders: a third quarter of decline would support the view that Leaderdrive and other domestic suppliers are taking share. Capex guidance: any increase above depreciation would be the first sign that management expects volume beyond current capacity.
Analyst view
Thesis: operating leverage on existing capacity, fed by three end markets at once, with humanoids a call option rather than a driver. Confidence: medium. The filings are clear on the margin mechanics and the regional mix; they are silent on the size of the AI-robot orders, which is the variable most investors care about.
What would change our view: disclosure of AI-robot order values, a sustained rise in North American mechatronics orders, or a capex increase tied to new robot customers would make humanoid demand a visible driver. A fall in book-to-bill below 1.0 with China still shrinking would point the other way.
Questions you should be asking
How much of the ¥4.4 billion North American mechatronics order intake is the surgical-robot order, and over what period will it ship? How large are the AI-robot mass-production orders won last year, and in which segment and product line are they booked? Is the fall in China reducer orders a loss of share to domestic suppliers or a cut in customers' build plans? At what utilisation would the company need to raise capex above depreciation, and how long would new capacity take? How much of the 9.6% sales-forecast increase comes from the changed currency assumptions?